OCCASIONAL REPORT
Why is Teenage Pregnancy Declining? The Roles of Abstinence, Sexual Activity and Contraceptive Use
By Jacqueline E. Darroch and Susheela Singh
Introduction
The 1990s have witnessed sustained declines in teen-age birthrates--a heartening development in view of the often negative effects of adolescent childbearing on young women and their children and the costs to society as a whole.1 Teenage births should not be the only concern, however. More than three-quarters of pregnancies among teenagers each year are unintended, and more than one-quarter end in abortion;2 therefore, helping young women avoid an unintended pregnancy is also an important public policy goal. Here, again, the news is encouraging: The teenage pregnancy rate also dropped in the 1990s.3
Nevertheless, some 900,000 Americans younger than 20 become pregnant every year, and the U.S. teenage pregnancy rate is one of the highest in the developed world.4 Ensuring the continuation of the downward trend in teenage pregnancy is essential, and a key step is understanding the factors behind the progress already made.
Declines in teenage pregnancies can be achieved through two mechanisms--changes in sexual behavior and changes in contraceptive use. Some observers have claimed that the declines are the result of increased abstinence.5 Others credit both greater abstinence and increased contraceptive use, especially condom use, among teenagers, but have not quantified their specific contributions to the falling rates.6
Broad societal factors underlie both mechanisms. Fear of HIV, changing attitudes about sexuality and availability of new contraceptive technologies may affect sexual activity and change patterns of method use among those who do have intercourse. The strong economy, with its promise of improved career opportunities for young people, and welfare reform, with its constraints on the receipt of public assistance, may affect these behaviors, since greater educational and employment opportunity are linked to lower teenage pregnancy rates and birthrates. Additionally, numerous interventions have been put into place to encourage young people to delay becoming sexually active and to use contraceptives effectively when they have sex. While there is need for increased evaluation and monitoring of such programs, some show great promise.7 Clearly, it is useful for the design of policies and interventions aimed at averting teenage pregnancy to identify and quantify how these factors have affected teenagers' sexual behavior, contraceptive use and, ultimately, pregnancy rates. Such investigation is, however, outside the scope of this effort.
As a first step, however, this report presents results of analyses that used the most current data to document the breadth of drops in teenage pregnancy and to examine the contributions to these trends of changes in abstinence, the sexual behavior of those who ever had intercourse and contraceptive use. The analyses were based on information from the 1988 and 1995 cycles of the National Survey of Family Growth (NSFG) and recent information on rates of teenage pregnancies, births and abortions.
What Are the Trends?
Since the early 1990s, teenage pregnancy rates, birthrates and abortion rates have declined dramatically; pregnancy and abortion rates have reached their lowest points since they were first measured in the early 1970s, and birthrates are similar to those that prevailed between the mid-1970s and mid-1980s.8
The decreases in pregnancy and abortion rates have been especially steep. In 1986, some 107 pregnancies occurred per 1,000 women aged 15-19; by 1990, that rate had climbed 11% to 117 per 1,000 (Figure 1).9 Within the next six years, however, the rate fell by a striking 17% to 97 pregnancies per 1,000 teenagers, 9% less than the 1986 rate.
The teenage birthrate followed a similar trend, although the recent decrease has been less rapid. From a level of 50 births per 1,000 women aged 15-19 in 1986, the rate rose rapidly to 62 per 1,000 in 1991, an increase of 24%. The next five years saw a turnaround, and in 1996, 54 births occurred per 1,000 teenage women--a rate still higher than that in 1986, but 12% lower than the peak reached in 1991.
A somewhat different pattern is seen in the teenage abortion rate, which varied little during the 1980s and then began a steady decline. By 1996, the rate was 29 abortions per 1,000 young women--31% lower than teenagers' abortion rate a decade earlier.
Declines Are Widespread
An examination of the data for various subgroups of teenagers reveals that with little exception, the trends in pregnancy rates have followed the same general pattern across the board, regardless of young women's age, marital status, race or ethnicity.
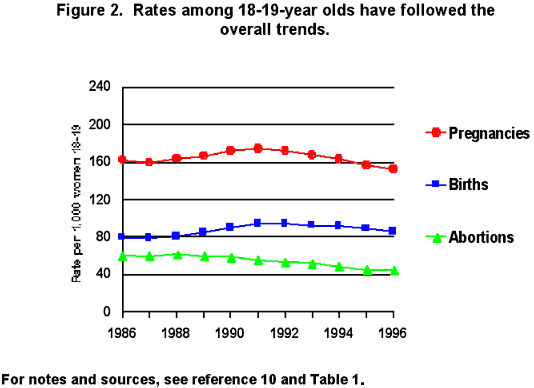
Among 18-19-year-olds, the pregnancy rate climbed 8% from the late 1980s until 1991; by 1996, the pregnancy rate had dropped to 12% below the peak level (Figure 2).10 The birthrate followed a similar pattern, falling 9% between 1991 and 1996. The abortion rate among these oldest teenagers hovered around 60 abortions per 1,000 women through much of the 1980s, began a gradual decline in 1990 and had fallen to 45 per 1,000 by 1996, roughly a 25% drop.
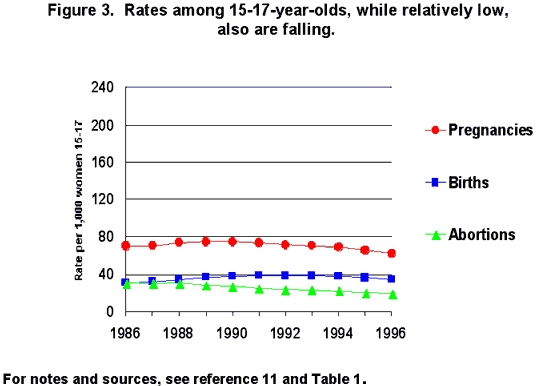
Likewise, for 15-17-year-olds, the pregnancy rate hit its peak in 1991, then fell off 17% by 1996 (Figure 3).11 The birthrate fell 13% during that period, while the abortion rate among these young women began to drop in the late 1980s and was 36% lower in 1996 than it had been a decade earlier.
Even among teenagers 14 and younger, who have always had very low rates, pregnancy became even less common in the early 1990s. Some 13 pregnancies occurred per 1,000 females in this age-group in 1996, a reduction from rates of about 17 per 1,000 from the mid-1980s until 1993.12
The small proportion of teenagers who are married (4% of women aged 15-19 in 199613) have also registered very substantial declines in their rates. Between 1990 and 1996, the pregnancy rate among married women aged 15-19 dropped 19%, from 535 to 432 per 1,000, and the birthrate fell 18%, from 420 to 344 per 1,000. These changes reflect both that married teenagers are becoming less likely to conceive and that teenagers who become pregnant out of wedlock are becoming less likely to marry before their baby is born. While abortion rates have consistently been very low among married teenagers, they dropped 43% between 1988 and 1996, from 31 per 1,000 to 18 per 1,000.14
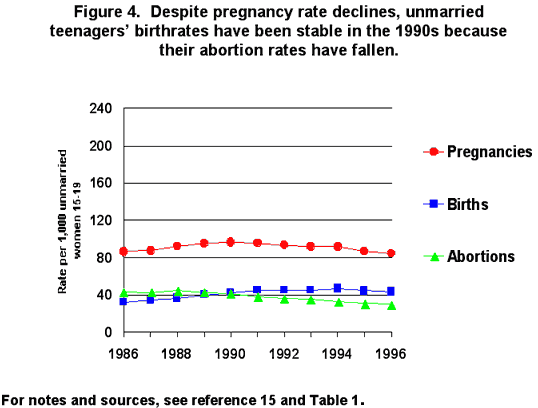
Trends among unmarried teenagers have followed a somewhat different pattern (Figure 4).15 While pregnancy rates declined 14% between 1990 and 1996, the birthrate increased steadily between 1986 and the early 1990s, leveled off and then declined 8% between 1994 and 1996. Still, the rate was 33% higher in 1996 than a decade earlier. At the same time, the abortion rate among unmarried teenagers declined 31%. Thus, the rise in the birthrate reflects the decreasing likelihood not only that unmarried pregnant teenagers will marry before they give birth but also that they will end their pregnancies by abortion.
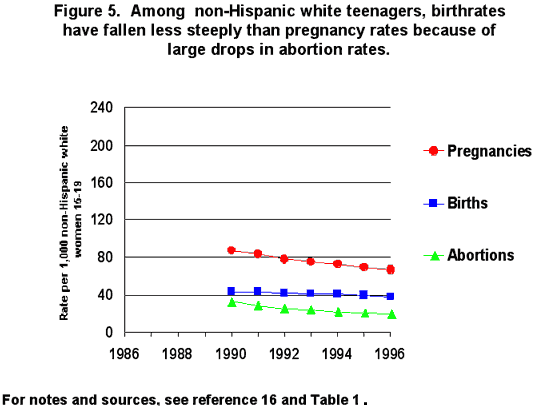
Non-Hispanic white teenagers have historically had lower rates than black adolescents or Hispanic young women of any race, a trend that continued in the 1990s. Furthermore, their rates dropped during this period (Figure 5); pregnancy and abortion rates fell more steeply than birthrates (24% and 41% vs. 12%).16
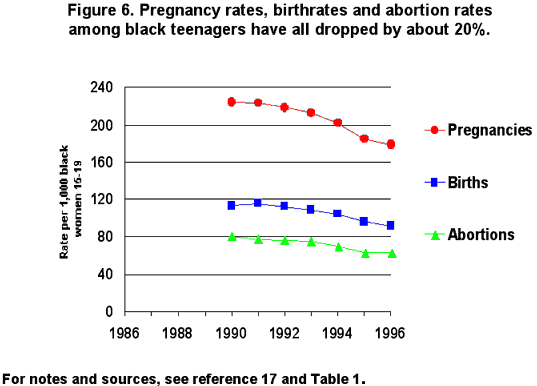
Through much of the 1990s, black teenagers had the highest rates. However, all three rates dropped by about 20% between 1990 and 1996 (Figure 6).17 Because the birthrate declined more steeply among black than among white teenagers, the gap between these two groups narrowed.
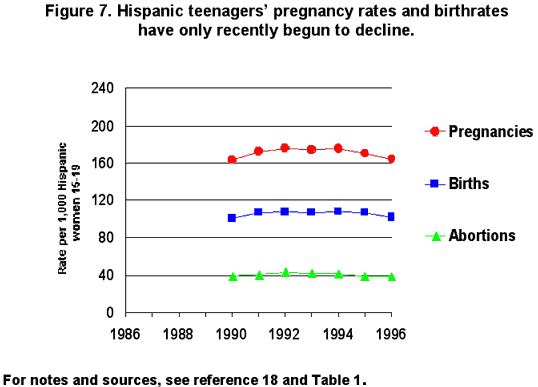
By contrast, rates among Hispanic teenagers increased through the early 1990s (Figure 7).18 The pregnancy and abortion rates declined slightly after 1993, but the birthrate remained stable through 1994 and then declined 5%. As a result, Hispanic teenagers now have the highest birthrate.
U.S. teenagers are not the only age-group whose rates of pregnancies, births and abortions are on the decline. Rates for women in their early 20s, while higher than those for teenagers, follow the same general patterns. After increasing in the late 1980s, pregnancy rates and birthrates for women aged 20-24 dropped 7% and 5%, respectively, between 1990 and 1996. The abortion rate for this group fell even more steeply--11%. The birthrate among unmarried women aged 20-24 rose 43%, from 49 births per 1,000 in 1986 to 71 per 1,000 in 1996.19
What Accounts for These Trends?
A great deal of public attention has focused on the welcome drop in the teenage birthrate, but the widespread trends documented here show that it is only part of the picture. The birthrate decline reflects changes in the level of teenage pregnancies and in how these pregnancies are resolved. Birthrates can fall if pregnancy rates decline or if women who become pregnant make increasing use of abortion to avoid unwanted births. To which of these factors do the data point as the chief explanation for declining teenage birthrates?
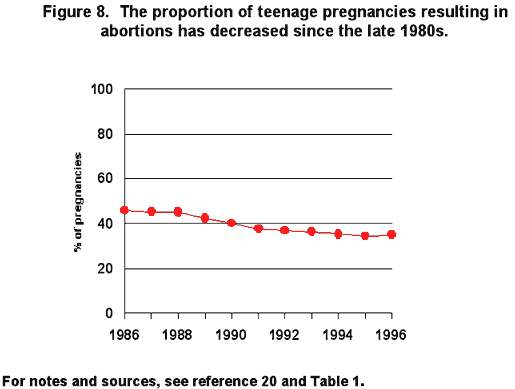
Between 1991 and 1996, the proportion of teenage pregnancies ending in abortions decreased from 38% to 35% (Figure 8).20 Therefore, teenagers' birthrate declines were attributable to reductions in their pregnancy rate. The question therefore becomes what explains the pregnancy rate decline.
The pregnancy rate for all teenagers is mathematically the product of two factors: the proportion of young women who are potentially at risk of becoming pregnant because they have had intercourse and the rate at which those young women who have initiated sexual intercourse become pregnant. Therefore, examining changes in these factors over time is the key to understanding the extent to which each contributed to the decline in the overall teenage pregnancy rate.
Information available for such an examination is limited in a number of ways, including being only for 1988 and 1995 (but not for 1990-1996, when the steepest drop in the pregnancy rate occurred) and being based on samples of adolescents too small to detect small changes accurately.21 This analysis therefore investigates reasons for change in the overall teenage pregnancy rate between 1988 and 1995; the trends, however, may differ across subgroups, as well as for other time periods.
Changes in Sexual Behavior and Pregnancy Rates Contributed to Declines
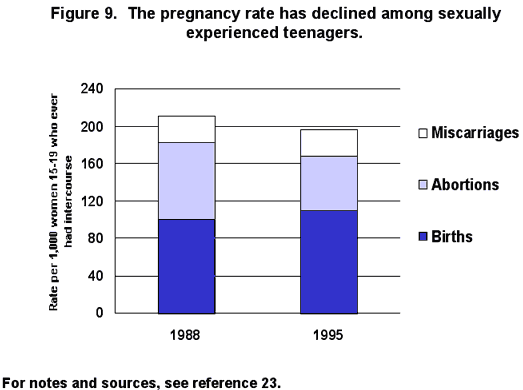
Between 1988 and 1995, the teenage pregnancy rate dropped 10 points, from 111 to 101 pregnancies per 1,000 young women. During this period, according to the NSFG, the proportion of teenagers who had ever had sex decreased by 2%--from 52.6% to 51.3%.22 In addition, sexually experienced young women became considerably less likely to conceive during these years; their pregnancy rate fell from 212 to 197 per 1,000 (Figure 9).23
The relative contributions of changes in the proportion of adolescent women who have ever had sex and the pregnancy rate among those who are sexually experienced can be estimated by calculating what the pregnancy rate would have been if only one of these factors had changed. The analysis assumes that the decline between 1988 and 1995 in the proportion of women aged 15-19 who had ever had intercourse was real, even though it was not statistically significant. These calculations indicate that roughly one-fourth of the drop in the teenage pregnancy rate between 1988 and 1995 resulted from increased abstinence (i.e., a decline in the proportion of young women who had had sex), and approximately three-fourths from decreased pregnancy rates among sexually experienced teenagers (see box below).24
Calculating the Contributions of Changes in Abstinence and in the Pregnancy Rate of Sexually Experienced Teenagers
Dividing the overall teenage pregnancy rate by the proportion of teenagers who were sexually experienced yields the pregnancy rate among sexually experienced women aged 15-19. Thus, in 1988, when the pregnancy rate was 111.4 per 1,000 women aged 15-19, and 52.6% of women in that age-group had had sexual intercourse, the pregnancy rate among sexually experienced 15-19-year-olds was 211.8 per 1,000 (111.4/0.526=211.8). In 1995, the overall teenage pregnancy rate was 101.1 per 1,000, and 51.3% of women aged 15-19 had had sex; therefore, the pregnancy rate among sexually experienced women aged 15-19 was 197.1 per 1,000 (101.1/0.513=197.1).
If the proportion of women who were sexually experienced had decreased (from 52.6% in 1988 to 51.3% in 1995), but the pregnancy rate among sexually experienced women aged 15-19 had remained unchanged (at 211.8 per 1,000), the overall teenage pregnancy rate (the product of these two factors) would have been 108.7 per 1,000 (0.513x211.8=108.7) in 1995. This would have represented a decrease of 2.7 pregnancies per 1,000 (from 111.4 in 1988). Thus, roughly 25% of the actual decrease of 10.3 pregnancies per 1,000 was due to the lowered proportion of sexually experienced teenagers.
By contrast, if the proportion of women aged 15-19 who had ever had sex had stayed at the 1988 level of 52.6%, and the pregnancy rate among those who were sexually experienced had fallen (from 211.8 in 1988 to 197.1 in 1995), the overall pregnancy rate in 1995 would have been 103.7 per 1,000 young women (0.526x197.1=103.7). This decrease of 7.7 pregnancies per 1,000 due to the lowered pregnancy rate among sexually experienced young women is about 75% of the total observed decline in the pregnancy rate per 1,000 women 15-19.
For notes and sources, see reference 24.
Why Has the Pregnancy Rate Among Sexually Experienced Teenagers Declined?
An important question for further investigation is how sexually experienced teenagers have become more successful at avoiding pregnancy. Have they reduced their exposure to the chance of pregnancy by decreasing the frequency with which they have intercourse? Or have they lowered their risk of conceiving when they have sex by increasing their use of contraceptive methods or using more effective contraceptives?25 Any combination of these factors may come into play, and the focus here is on what behavioral changes contributed to declining pregnancy rates, not what caused the behavioral changes.
Average Frequency of Sexual Intercourse Has Changed
Although much of the attention to changing adolescent sexual behavior has been focused on increasing abstinence, other measures also reflect teenagers' risk of pregnancy. The average exposure of sexually experienced women to intercourse has changed little in recent years. For example, some 79% of sexually experienced teenagers participating in the 1995 NSFG reported having had sex in the previous three months, compared with 81% of their counterparts in 1988.26
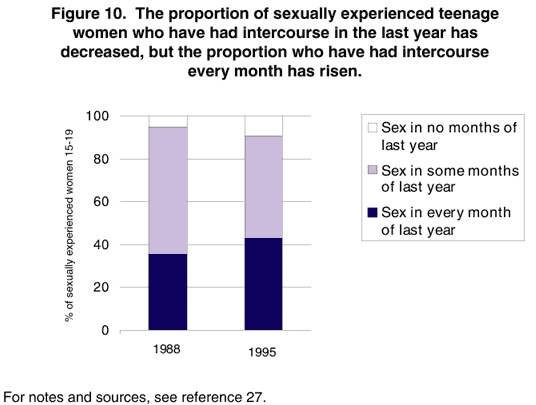
More importantly, while a greater proportion of sexually experienced teenagers in 1995 than in 1988 reported not having had sex in the last year (9% vs. 5%), fewer had intercourse in some but not all months of the last year (49% vs. 60%) and a larger proportion said they had had intercourse in every month of the year (43% vs. 35%--Figure 10).27As a result of these counterbalancing changes, the average number of months in which sexually experienced teenagers had had intercourse in the previous year was unchanged--8.6 months.28
Similarly, there was little change in how often sexually active teenagers had intercourse between 1988 and 1995. In both years, about half of those who had had sex within the previous three months reportedly had had intercourse at least weekly, although the proportion reporting intercourse four or more times a week grew from 4% to 10%.29
Using some of these measures of sexual activity instead of the proportion of young women who have ever had sex yields different allocations of the contribution of changing sexual behavior to the pregnancy rate decline between 1988 and 1995--ranging from 0% to 65% of the overall decline. The most relevant of these other meassures adjusts the proportion of women aged 15-19 who had sex in a year's time for the average number of months in which they had intercourse. Calculations using this measure show the same impact as calculations using a change in abstinence levels--roughly one-quarter of the overall pregnancy rate decline resulted from lowered sexual exposure, and three-quarters from a lower rate of pregnancy among those having sex.30
Trends in Contraceptive Use Are Mixed
Data from the NSFG provide snapshots of teenagers' contraceptive use at three points: the first time they had intercourse, during the month preceding the survey and the last time they had intercourse. The greatest change is an increase in the proportion of sexually experienced teenagers who report having used a method at first sex. Some 75% in 1995 gave this response, compared with 65% in 1988 (Figure 11);31 this improvement was due mostly to the rise in condom use from 48% to 63% at first intercourse.
However, method use at first intercourse reflects a onetime experience, and measures of subsequent use among teenagers when they are at risk of unintended pregnancy (i.e., are having sex, are fertile and are not pregnant, postpartum or trying to become pregnant) show less-encouraging signs. For example, in 1988 and 1995, the proportion of teenagers at risk who said they were using a contraceptive during the month they were interviewed increased only 3%, from 78% to 80%.32
In contrast to these increases, the proportion of those who had had intercourse in the previous three months who had used a method at last sex fell from 85% to 83%. The decrease was especially marked for nonhormonal, coitus-related methods other than the condom (withdrawal, spermicides and periodic abstinence).33
Teenagers Are Using More Effective Methods
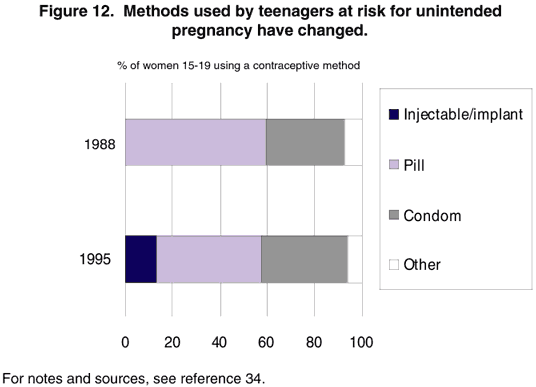
Teenage contraceptive users have increasingly adopted long-acting hormonal methods (the injectable and the implant), which have the lowest failure rates of all reversible methods. These methods, which became available only in the early 1990s, accounted for 13% of current use by 1995 (Figure 12): Some 10% of teenage users relied on the injectable and 3% on the implant. Condom use increased slightly, while reliance on oral contraceptives declined substantially.34
Primarily because of this shift to long-acting methods, overall contraceptive effectiveness among teenagers improved between 1988 and 1995--or, put another way, teenage contraceptive users grew less likely to become pregnant. Given the method patterns of contraceptive users in 1988, an estimated 16% became pregnant within a year after beginning use; by 1995, the proportion had dropped to 15%--a very modest improvement in absolute terms, but roughly a 9% decline.35
Policy Implications
The recent decline in the teenage pregnancy rate in the United States is a very welcome development, and the reasons for this decrease have been the subject of much speculation. By documenting the components of change in teenagers' reproductive behavior, this report is a crucial first step down the path toward further improvement. It has shown that the teenage birthrate has decreased since 1991 because of lower pregnancy rates among sexually experienced women aged 15-19, not because of a rise in abortions.
Improvements in pregnancy prevention among sexually experienced teenagers that occurred during the 1970s and early 1980s were counterbalanced by steady increases in the proportions of young women who had had sex. This resulted in climbing or stable overall pregnancy rates throughout the time period.36
This analysis shows an important change in that pattern: The available data show that between 1988 and 1995, both factors worked in the same direction to jointly contribute to decreasing overall pregnancy rates among adolescent women. The conclusions are tentative ones, because the shifts in sexual behavior have been too small to identify as statistically significant even within the relatively large national samples of the NSFG and because of the long time period between surveys, but the data indicate a change from the patterns of the 1970s and early 1980s.
• It appears that increased abstinence among women accounted for approximately one-quarter of the drop in the U.S. teenage pregnancy rate between 1988 and 1995.
• Changes in levels of sexual activity among those who were not abstinent probably had little, if any, net effect on the pregnancy rate, because changes in some measures of sexual activity among those who had had intercourse were matched by changes in the opposite direction.
• Trends in the level of contraceptive use were mixed, but a shift in teenage contraceptive use to the newly available long-acting hormonal methods, primarily the injectable contraceptive, was a significant change toward increasing sexually experienced young women's effectiveness in preventing pregnancy.
These findings show that reduction in sexual activity and use of more effective contraceptive methods both played roles in the recent decline in teenage pregnancy rates and birthrates. Both of these behavioral changes were undoubtedly influenced by broader societal changes in policy and programs, and in attitudes and values. We have yet to understand many of these changes and their interconnections.
Even so, these findings suggest that the best strategy for continuing the declines in teenage pregnancy levels is a multifaceted approach. Programs and policies should aim at encouraging teenagers--particularly those at the youngest ages--to postpone intercourse and at supporting sexually experienced youths who wish to refrain from further sexual activity. At the same time, it must be recognized that most young people become sexually active during their teens, and sexuality education and information should also prepare them to adequately prevent pregnancy and sexually transmitted infection if and when they do have sex. Services should be in place that will help them to behave responsibly--to ensure that they use contraceptives and to help them improve the effectiveness with which they practice contraception. That means providing adequate education and information about sexual behavior and its consequences, as well as confidential, affordable and accessible sources of contraceptive services and supplies, and support for research and development of new contraceptive methods that young people will find acceptable and easy to use effectively.
Notwithstanding the multiple pressures and demands that teenagers must face and manage, it is up to them to take responsibility for their behavior. At the same time, it is equally the responsibility of policymakers, educators, parents and society at large to prepare them to do so, and to make the environment as conducive as possible to their being able to do so successfully.
Figures and Table


References and Notes
1. Ventura SJ, Matthews MS and Curtin SC, Declines in teenage birth rates, 1991-1998: update of national and state trends, National Vital Statistics Reports, 1999, Vol. 47, No. 26; The Alan Guttmacher Institute (AGI), Sex and America's Teenagers, New York: AGI, 1994; and Maynard RA, Kids Having Kids, Washington, DC: Urban Institute Press, 1997.
2. Note: A pregnancy is defined as unintended if the woman had an induced abortion or if she gave birth at a time she had wanted not to have a baby.
Source: Henshaw SK, Unintended pregnancy in the United States, Family Planning Perspectives, 1998, 30(1):24-29 & 46.
3. Henshaw SK, U.S. teenage pregnancy statistics, with comparative statistics for women aged 20-24, New York: AGI, 1999.
4. Ibid.; and Singh S and Darroch JE, Adolescent pregnancy and childbearing: levels and trends in industrialized countries, Family Planning Perspectives, 2000, 32 (forthcoming).
5. Jones JM et al., The declines in adolescent pregnancy, birth and abortion rates in the 1990s: what factors are responsible? Fanwood, NJ: Consortium of State Physicians Resource Councils, 1999.
6. Donovan P, Falling teen pregnancy, birthrates: What's behind the declines? The Guttmacher Report on Public Policy, 1998, 1(5):6-9; and Ventura SJ et al., Declines in teenage birth rates, 1991-97: national and state patterns, National Vital Statistics Reports, 1998, Vol. 47, No. 12.
7. Note: The federal-state abstinence-only funding that was part of welfare reform legislation began in FY 1998, after the time period for which pregnancy data are available. (Sources: PL 104-193, Section 912; and Daley D and Wong VC, Between the Lines: States' Implementation of the Federal Government's Section 510(b) Abstinence Education Program in Fiscal Year 1998, New York: Sexuality Information and Education Council of the United States, 1999.)
Sources: Card JJ et al., The Program Archive on Sexuality, Health & Adolescence: promising 'prevention programs in a box,' Family Planning Perspectives, 1996, 28(5):210-220; Kirby D, No Easy Answers: Research Findings on Programs to Reduce Teen Pregnancy, Washington, DC: The National Campaign to Prevent Teen Pregnancy, 1997; Moore KA et al., Adolescent Pregnancy Programs: Interventions and Evaluations, Washington, DC: Child Trends, 1995; AGI, 1994, op. cit. (see reference 1); and Landry DL, Kaeser L and Richards CL, Abstinence promotion and the provision of information about contraception in public school district sexuality education policies, Family Planning Perspectives, 1999, 31(6):280-286.
8. Henshaw SK, 1999, op. cit. (see reference 3); Ventura SJ, Matthews MS and Curtin SC, 1999, op. cit. (see reference 1).
9. Notes: All rates refer to age at time of outcome. Pregnancies include miscarriages, estimated as 20% of births plus 10% of abortions. (Source: Leridon H, Human Fertility: The Basic Components, Chicago: University of Chicago Press, 1977, Table 4.20.)
Source: AGI, Teenage pregnancy: overall trends and state-by-state information, New York: AGI, 1999.
10. Note: See reference 9.
Source: Henshaw SK, 1999, op. cit. (see reference 3).
11. Note: See reference 9.
Source: Henshaw SK, 1999, op. cit. (see reference 3).
12. Notes: See reference 9. The numerators for rates among women 14 and younger include pregnancies, births and abortions among all those younger than 15 at outcome; the denominators are females aged 14. Since some pregnancies, births and abortions occurred among women younger than 14, these rates slightly overstate the actual rates among 14-year-olds. For annual rates, see Table 1.
Source: Henshaw SK, 1999, op. cit. (see reference 3).
13. Saluter AF and Lugaila TA, Marital status and living arrangements: March 1996, Current Population Reports, 1998, Series P-20, No. 496, Table 1.
14. Notes: See reference 9. All rates refer to marital status at time of outcome. The rates shown here understate conception rates among unmarried teenagers (those who were never-married, divorced or widowed) and overstate rates among married teenagers (including those who were separated from their husband). Of first births to women who were married at delivery, only 52% in 1985-1989 and an estimated 45% in 1990-1994 resulted from conceptions occurring within marriage; of first births resulting from out-of-wedlock conceptions, 19% in 1985-1989 and 16% in 1990-1994 were to women who married before delivery. (Sources: Bachu A, Fertility of American women: June 1990, Current Population Reports, 1995, Series P-20, No. 454, Table E; and Bachu A, Timing of first births: 1931-34 to 1990-94, Working Paper, Washington, DC: Population Division, U.S. Bureau of the Census, 1998, No. 25, Figures 9 and 10.) The apparent dip in marital birthrates and pregnancy rates in 1994 may result from changes in the reporting and estimation of marital status for births. (Sources: Ventura SJ et al., Advance report of final natality statistics, 1994, Monthly Vital Statistics Report, 1996, Vol. 44, No. 11 (Supplement), pp. 82-83; and Ventura SJ et al., Advance report of final natality statistics, 1995, Monthly Vital Statistics Report, 1997, Vol. 45, No. 11 (Supplement), pp. 7-8.) For annual rates, see Table 1.
Sources: Nonmarital and marital births and birthrates for 1986-1993--Ventura SJ et al., The demography of out-of-wedlock childbearing, in: Department of Health and Human Services (DHHS), Report to Congress on Out-of-Wedlock Childbearing, Hyattsville, MD: DHHS, 1995, Table I-2, p. 88, and Table III-7, p. 118; and AGI, 1999, op. cit. (see reference 9). Nonmarital birth and birthrates and marital births for 1994-1996--Ventura SJ et al., Advance report of final natality statistics, 1994, Monthly Vital Statistics Report, 1996, Vol. 44, N
15. See notes and sources in reference 14.
16. Notes: See reference 9. Abortion and pregnancy data by Hispanic ethnicity are available only for 1990 and later. Rates for non-Hispanic women of races other than white and black are not shown because of small numbers, but these women are included in other figures presented here. Because race and ethnicity for women giving birth and having abortions are sometimes reported by someone other than the woman, they may not always be consistent with the race and ethnicity that the woman would have reported for herself.
Sources: Birthrates--Ventura SJ et al., Declines in teenage birth rates, 1991-97: national and state patterns, National Vital Statistics Reports, 1998, Vol. 47, No. 12, Table 2. Abortion rates among black teenagers--AGI, 1999, op. cit. (see reference 9). Rates for non-Hispanic white and Hispanic teenagers--Henshaw SK, AGI, unpublished tabulations, 1999.
17. Ibid.
18. Ibid.
19. Notes: See reference 9. For annual rates for women aged 20-24, see Table 1.
Sources: Henshaw SK, 1999, op. cit. (see reference 3); and Ventura SJ et al., Advance report of final natality statistics, 1996, Monthly Vital Statistics Report, 1998, Vol. 46, No. 11 (Supplement), Table 18.
20. AGI, 1999, op. cit. (see reference 9). Miscarriages are not included in the denominator.
21. National data on sexual behavior and contraceptive use among women aged 15-19 are available from the 1988 and 1995 NSFGs. A 1990 follow-up to the 1988 survey more closely coincides with the peak teenage pregnancy rates; however, it differed in important ways from the 1988 and 1995 surveys, and therefore is an inappropriate source of data for examining time trends. Whereas the 1988 and 1995 surveys used comprehensive personal household interviews, the follow-up survey was conducted through short telephone interviews; this difference may have affected teenagers' reporting of sensitive topics, such as sexual behavior and contraceptive use. Additionally, low response rates to the 1990 survey limit the generalizability of the data. The response rate for the 1988 NSFG was 79%, allowing for nonresponse to both the National Health Interview Survey (NHIS), from which the NSFG sample was drawn, and the NSFG itself. (Source: Mosher WD, Contraceptive practice in the United States, 1982-1988, Family Planning Perspectives, 1990, 23(5):190-205.) The 1990 telephone survey reinterviewed only 68% of women aged 17-44 who had responded to the 1988 NSFG, or about 55% of the original sample. A subsample of women aged 15-17 in 1990 was added from NHIS respondent households; 53% of these women participated in the 1990 interviews. (Source: Peterson LS, Contraceptive use in the United States: 1982-1990, Advance Data from Vital and Health Statistics, 1995, No. 260.) Respondents to the 1995 NSFG represented 81% of women aged 15-17 and 77% of women aged 18-44 selected from the 1993 NHIS, which had a response rate of about 95%, for overall response rates of roughly 77% and 73%, respectively. (Sources: Kelly JE et al., Plan and operation of the 1995 National Survey of Family Growth, Vital and Health Statistics, 1997, Series 1, No. 35; and Mosher WD, Design and operation of the 1995 National Survey of Family Growth, Family Planning Perspectives, 1998, 30(1):43-46.)
22. Notes: Sexually experienced women include all those aged 15-19 at the time of their NSFG interview who had ever had intercourse (voluntary or involuntary) since menarche. The change between 52.6% in 1988 and 51.3% in 1995 is not statistically significant; the 95% confidence intervals are 47.8-57.4% for the 1988 estimate and 48.4-54.2% for 1995. (Source: Tabulations from the 1988 and 1995 NSFGs.) Generally, the proportion of women who had ever had intercourse since menarche did not change significantly from 1988 to 1995 for subgroups of women by age or race and ethnicity; the exception was that Hispanic women aged 15-17 were more likely to have had intercourse in 1995 than in 1988.
The estimates of sexual exposure are quite sensitive to variable definitions. The proportion of women aged 15-19 in the 1988 NSFG who had ever had intercourse since menarche is 52.9% when age is based on the respondents' age at the actual date used to select the sample (March 15, 1988), but 52.6% when it is based on the respondent's age at the actual date of the interview. In the 1995 NSFG, the proportion of 15-19-year-olds who ever had intercourse (voluntary or involuntary) since menarche is 50.4% when age is based on the sample selection date (April 1, 1995), but 51.3% when based on the date of interview. The 1988 NSFG did not distinguish voluntary from involuntary intercourse; in the 1995 survey, 51.0% of women aged 15-19 at the date of their interview had had only voluntary intercourse since menarche. Including young women who had had intercourse only prior to menarche would increase the proportions who had ever had intercourse (based on age at interview) from 52.6% to 52.9% in 1988 and from 51.3% to 51.7% in 1995.
Sources: Singh S and Darroch JE, Trends in sexual activity among adolescent American women: 1982-1995, Family Planning Perspectives, 1999, 31(5):212-219; and tabulations from the 1995 NSFG.
23. Note: See reference 9.
Sources: AGI, 1999, op. cit. (see reference 9); Singh S and Darroch JE, 1999, op. cit. (see reference 22); and tabulations from the 1995 NSFG.
24. Notes: In addition to effects of changes in the proportion of women aged 15-19 who ever had intercourse (25%) and in the pregnancy rate of sexually experienced young women (75%), the interaction of these two factors accounted for -2% of the change in the overall pregnancy rate.
These calculations are rough estimates because there is a margin of error around the measures of sexual activity (see notes in reference 22). The proportion of 15-19-year-olds who had ever had intercourse would have to have decreased from 52.6% in 1988 to 47.7% in 1995 for increased abstinence to have accounted for the entire pregnancy rate decline. This is slightly above the 1982 level and outside the 95% confidence interval for the 1995 proportion who had ever had sex; that is, a change this large would have been identified in the NSFGs. For increased abstinence to have accounted for half of the pregnancy rate drop, the proportion sexually experienced would have to have decreased to 50.2% in 1995; since that proportion is within the 95% confidence interval for that year, a change of this magnitude cannot be ruled out, given the margin of error around the NSFG estimates.
Sources: Pregnancy rates--AGI, 1999, op. cit. (see reference 9). Proportions of young women who ever had sexual intercourse (voluntary or involuntary) since menarche--Singh S and Darroch JE, 1999, op. cit. (see reference 22); and tabulations from the 1995 NSFG.
25. Notes: Effects of other factors could also influence the pregnancy rates of sexually experienced teenagers, but are unlikely to have done so or cannot be measured with available data. For example, the biological fecundity of young women or their partners could have decreased. However, almost all women aged 15-19 have experienced menarche, and the age of menarche appears to have continued to drop over the period in question. (Sources: Forrest JD, Timing of reproductive life stages, Obstetrics and Gynecology, 1993, 82(1):105-111; and Abma J et al., Fertility, family planning, and women's health: new data from the 1995 National Survey of Family Growth, Vital and Health Statistics, 1997, Series 23, No. 19, Table 18.) Similarly, while a number of reports have suggested that sperm counts in the United States are declining, further analysis indicates that no significant change has occurred during the last 50 years. (Source: Saidi JA et al., Declining sperm counts in the United States? a critical review, Journal of Urology, 1999, 161(2): 460-462.)
The proportion of sexually experienced women aged 15-19 who have had two or more sexual partners increased from 58% in 1988 to 63% in 1995, according to data from the comparable, interview-administered portion of the survey. (Sources: Kost K and Forrest JD, American women's sexual behavior and exposure to risk of sexually transmitted diseases, Family Planning Perspectives, 1992, 24(6):244-254; and Abma J et al., Fertility, family planning, and women's health: New data from the 1995 National Survey of Family Growth, Vital and Health Statistics, 1997, Series 23, No. 19, Table 30.) The number of sexual partners is less strongly related to the risk of pregnancy, however, than is the frequency of intercourse. (Source: Cates W Jr., Sexually transmitted diseases and family planning: strange or natural bedfellows? Sexually Transmitted Diseases, 1993, 20(3): 174-178.)
26. Note: The 1995 proportion of women 15-19 who had sex in the three months prior to interview was calculated both from direct questions and from information in the partnerships and contraceptive history sections of the interview. These calculations exclude women whose only sexual experience after menarche was involuntary.
Source: Tabulations from the 1988 and 1995 NSFGs.
27. Tabulations from the 1988 and 1995 NSFGs.
28. Ibid.; and Singh S and Darroch JE, 1999, op. cit. (see reference 22).
29. Note: Among women aged 15-19 at the time of their NSFG interview who had had sex in the three months prior to interview and who provided information on frequency, 3.7% in 1988 had had intercourse four or more times a week during that period; 29.0%, 2-3 times a week; 18.0%, once a week; 29.1%, 2-3 times a month; and 20.2% once a month or less. In 1995, the proportions were 9.5% having had sex four or more times a week; 24.1%, 2-3 times a week; 16.6%, once a week; 26.9%, 2-3 times a month; and 22.6%, once a month or less.
Source: Tabulations from the 1988 and 1995 NSFG.
30. The calculations for apportioning the change in the overall pregnancy rate to changes in sexual behavior and in the pregnancy rate of those having sex use the same methodology as that described above (see box, page 8). The key points for each mea-sure of sexual behavior are outlined below.
• Had sex in the three months prior to interview: The proportion of women aged 15-19 at the NSFG survey date who had sex in the prior three months was 42.6% in 1988 and 40.3% in 1995, yielding pregnancy rates per 1,000 women aged 15-19 who had sex in the three months prior to interview of 261.5 in 1988 (111.4/0.426) and 250.9 in 1995 (101.1/0.403). If only the proportion who had sex in the three months prior to interview had changed, the 1995 overall pregnancy rate would have been 105.4--6.0 points lower than the actual rate. Thus, using this measure implies that the change in sexual behavior was responsible for 58% (6.0/10.3) of the decrease in the pregnancy rate, while 44% was due to a lower pregnancy rate among those having intercourse (4.3/10.3). Interaction between the changes in this sexual exposure measure and pregnancy rate accounted for -2% of the overall pregnancy rate change.
• Had sex in all 12 months of the past year: Some 35.4% of women aged 15-19 at interview date in 1988 had had sex in all 12 months of the past year, equal to 18.6% of all women aged 15-19 (52.6x0.354). In 1995, the proportion of sexually experienced women aged 15-19 who had sex throughout the past year was greater than in 1988 (42.9%), as was the proportion of all women aged 15-19 (51.3%x0.429=22.0%). Since the proportion of women aged 15-19 who had sex throughout the prior year increased from 1988 to 1995, the contribution of the change in this measure of sexual behavior was in the direction of increasing, rather than decreasing, the overall pregnancy rate. Thus, using this measure, declining sexual activity played no part in the overall pregnancy rate decrease, while the decreasing rate of pregnancy among those having sex using this measure accounted for all of the decrease.
• Had sex in any month of the past year: Some 49.9% of women aged 15-19 at the date of their NSFG interview in 1988 had had sex during the prior year, as had 46.9% in the 1995 NSFG. Pregnancy rates per 1,000 women aged 15-19 who had sex in the prior year were 223.2 in 1988 (111.4/0.499) and 215.6 in 1995 (101.1/0.469). If only the sexual exposure measure had changed between 1988 and 1995, the overall pregnancy rate would have been 104.7 (0.469x223.2), or 6.7 points lower than the 1988 rate. Thus, on the basis of this measure, 65% of the actual overall pregnancy rate decrease (6.7/10.3) would have been due to a decrease in the proportion of women aged 15-19 who had sex in the 12 months before 1988 and 1995, and 37%, to a decrease in their pregnancy rate (3.8/10.3). The interaction would have accounted for -2% of the overall pregnancy rate decline.
• Exposure-adjusted measure of sex in the past year: The proportion of women aged 15-19 who ever had sex was 52.6% in 1988 and 51.3% in 1995. In each year, those who had ever had sex reported having had intercourse for an average of 71.7% of the prior year (an average of 8.6 of the prior 12 months). Multiplying the proportions sexually experienced by this average annual exposure measure yields adjusted proportions exposed of 37.7% in 1988 (52.6%x0.717) and 36.8% in 1995 (51.3%x0.717). Another way of expressing these proportions is that they are the average number of years of sexual exposure among all women aged 15-19--i.e., an average of 377 years of sexual activity per 1,000 women aged 15-19 in 1988 and an average of 368 years per 1,000 in 1995. The pregnancy rate using this measure--i.e., the number of pregnancies in a year divided by the number of woman-years of sexual activity per 1,000 women aged 15-19--was 295.5 in 1988 and 274.7 in 1995. If only sexual exposure had changed between 1988 and 1995, the overall pregnancy rate would have been 108.7 (0.368x295.5), a level 2.7 points below the actual 1995 overall pregnancy rate. Thus, 26% of the 10.3-point decline in the overall pregnancy rate (2.7/10.3) would have been due to decreased sexual exposure and 75% to the lower pregnancy rate among those having sex. The interaction effect would have been -2% of the overall decline.
31. Notes: The proportion in 1995 who had used contraceptives at first intercourse refers only to use at first voluntary intercourse among those who had had voluntary intercourse after menarche; those whose first intercourse after menarche was involuntary were not asked about contraceptive use on that occasion. The proportion of all sexually experienced teenagers who used contraceptives at first intercourse would have changed little if none or all those who only had had involuntary sex after menarche had used contraceptives (74.9% and 75.4%, respectively, compared with 75.3% of those who ever had voluntary intercourse).The increase between 1988 and 1995 in use of any method at first intercourse is statistically significant at p<.001.
Source: Tabulations from the 1988 and 1995 NSFGs.
32. Note: The change in the level of current use among adolescents at risk of unintended pregnancy is not statistically significant.
Source: Tabulations from the 1988 and 1995 NSFGs.
33. Note: The proportion who had used a method at last intercourse is calculated for women aged 15-19 at the interview date who had had sex in the last three months and were not pregnant, postpartum, trying to become pregnant or infertile at the time of the interview. The decrease in the proportion who had used a method at last intercourse is not statistically significant.
In the 1995 NSFG, respondents who used no method in any of the three prior months or who used only a long-acting method (implant, injectable, IUD or contraceptive sterilization) were not asked about use at last intercourse. We have assumed that the women relying on a long-acting contraceptive used a method at last intercourse. In addition, 4% of current pill users in 1988 and 14% in 1995 reported using no method at last intercourse. Analysis of the 1995 survey showed most teenagers who used the pill in the survey month had, in fact, used it for all three recent months. (Source: Bankole A, tabulations from the 1988 and 1995 NSFGs.) Since a number of questions about consistency of pill use were added to the 1995 NSFG prior to the question about use at last intercourse and since oral contraceptives, like long-acting methods, require no action at the time of intercourse, we assumed that current pill users also had used their method at last sex, even if they said that they had used no method. The assumption that pill users who reported no method when asked about use at last intercourse were oral contraceptive users increased the 1995 proportion of women 15-19 at risk of unintended pregnancy using any method from 76.0% to 82.7%.
Source: Tabulations from the 1988 and 1995 NSFGs.
34. Note: The change between 1988 and 1995 in the proportion of current contraceptive users relying on a long-acting method (implant, injectable or IUD) is statistically significant at p<.001.
Source: Tabulations from the 1988 and 1995 NSFGs.
35. Note: Average pregnancy rates among contraceptive users were calculated by multiplying the 1988 and 1995 distributions of method users (tabulated from the 1988 and 1995 NSFGs) by the 1991-1994 first-year failure rates, according to method, poverty status and union status.
Source: Fu H et al., Contraceptive failure rates: new estimates from the 1995 National Survey of Family Growth, <http://www.agi-usa.org/pubs/journals/3105699.html>.
36. AGI, 1994, op. cit. (see reference 1), Figure 20, page 41.